ערכתי לאחרונה בתאריך 09.04.23 בשעה 23:10 בברכה, TGR
הי לכולם, במסגרת לימודי התואר בארכיטקטורה, כרגע אני עוסק בבנית סקריפט באמצעות py. דרך Spyder.
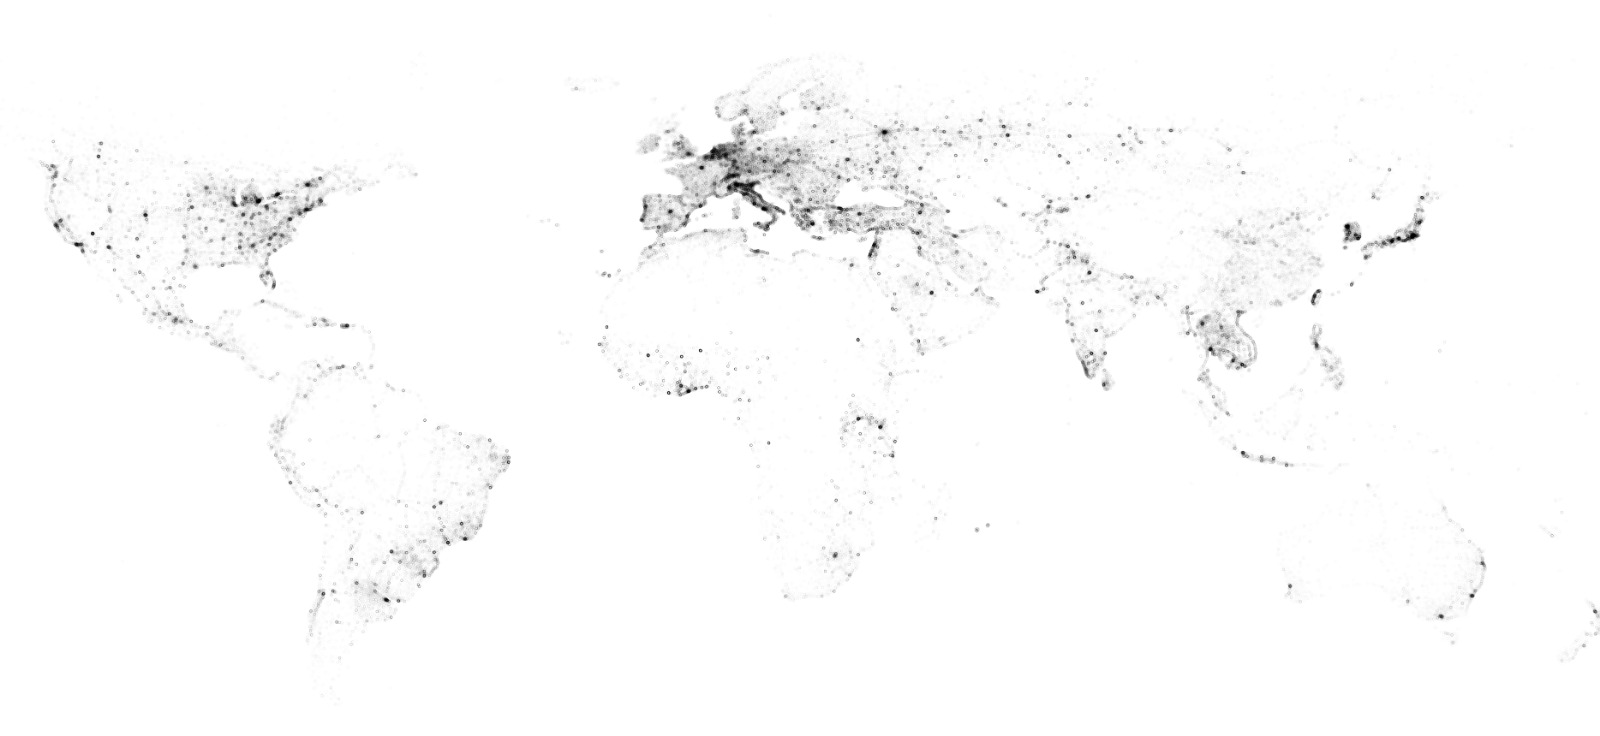
כאמור, אני דליתי מידע מ- OpenStreetMap המראה לי כמה תחנות דלק יש בעולם, יחד עם גבולות המדינות. האם יש דרך נוחה להמיר את הקוד לדפדפן "כרום" באופן די פשוט, כלומר, כשאני מבקש ממנו לשמור בקובץ SVG. אזי הדפדן בקושי מתמודד עם הנתונים.
גילוי נאות, בהכשרתי איני מפתח קודים, והכל נעשה במסגרת למידה עצמית במסגרת המוסד.
להלן הקוד, אשמח לעזרה;
[code]
[/code] import requests
import json
import numpy as np
import matplotlib.pyplot as plt
import geopandas as gpd
# Define the Overpass API query to get the fuel stations
overpass_url = "http://overpass-api.de/api/interpre?...
overpass_query = """
[out:json];
area["ISO3166-1"][admin_level=2];
(node["amenity"="fuel"](area);
way["amenity"="fuel"](area);
rel["amenity"="fuel"](area);
);
out center;
"""
# Make the request to the Overpass API and get the data
response = requests.get(overpass_url, params={'data': overpass_query})
data = response.json()
# Collect the coordinates of the fuel stations into a list
coords = []
for element in data['elements']:
if element['type'] == 'node':
lon = element['lon']
lat = element['lat']
coords.append((lon, lat))
elif 'center' in element:
lon = element['center']['lon']
lat = element['center']['lat']
coords.append((lon, lat))
# Convert the coordinates into a numpy array
X = np.array(coords)
# Read in the shapefile of country borders using GeoPandas
world = gpd.read_file(gpd.datasets.get_path('naturalearth_lowres'))
# Create a matplotlib figure and axis
fig, ax = plt.subplots(figsize=(15, 7.5), dpi=300)
# Plot the country borders
world.plot(ax=ax, facecolor='none', edgecolor='#dddddd', linewidth=0.5)
# Add the fuel stations to the plot
ax.scatter(X[:, 0], X[:, 1], s=0.0001, c='#b34877', alpha=0.3)
# Set the title, axis labels, and equal aspect ratio
plt.title('All Countries')
plt.xlabel('Longitude')
plt.ylabel('Latitude')
plt.axis('equal')
# Show the plot
plt.show()

 אשכול 22483
